Graphics and Printed Materials
Authors: Caroline Reed, Dane Haine, MS, Megan Rodgers Lane, MEA, and Kathleen M. Gray, PhD, UNC-Chapel Hill
Subject-Matter Experts / Reviewers: Wanda Bodnar, PhD, Rebecca Fry, PhD, Jackie MacDonald Gibson, PhD, and Jason Surratt, PhD, UNC-Chapel Hill; Jamie DeWitt, PhD, East Carolina University; David Genereux, PhD, Jane Hoppin, SciD, and Katy May, MS, NC State University; Jory Weintraub, PhD, Duke University
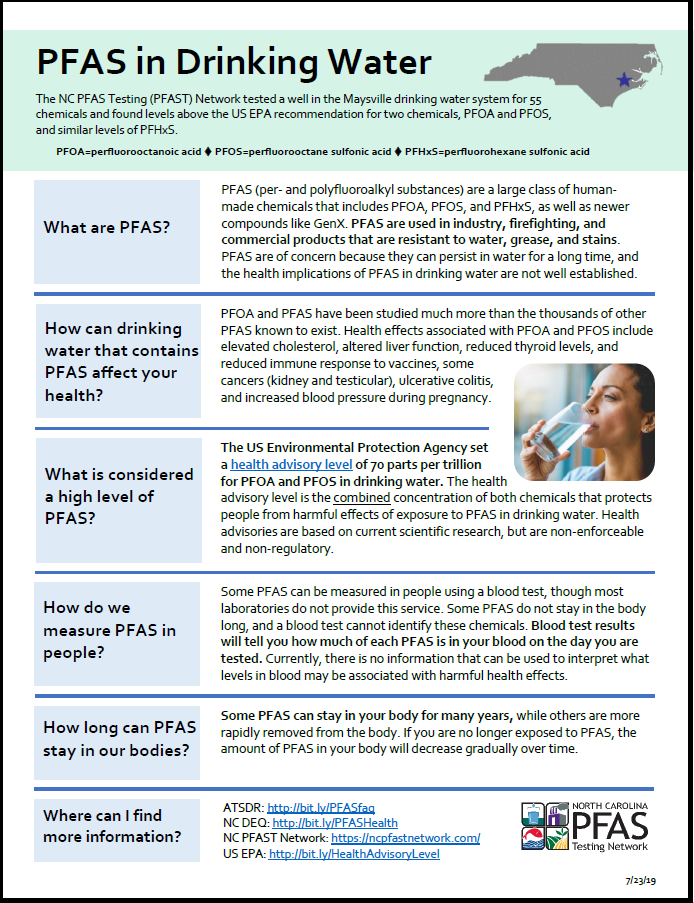
The NC PFAST Network tested a well in the Maysville drinking water system for 55 chemicals and found levels above the US EPA recommendation for two chemicals, PFOA and PFOS, and similar levels of PFHxS. The Network’s communications team developed this fact sheet in response to help Maysville community members understand these results.
Presentation Graphics
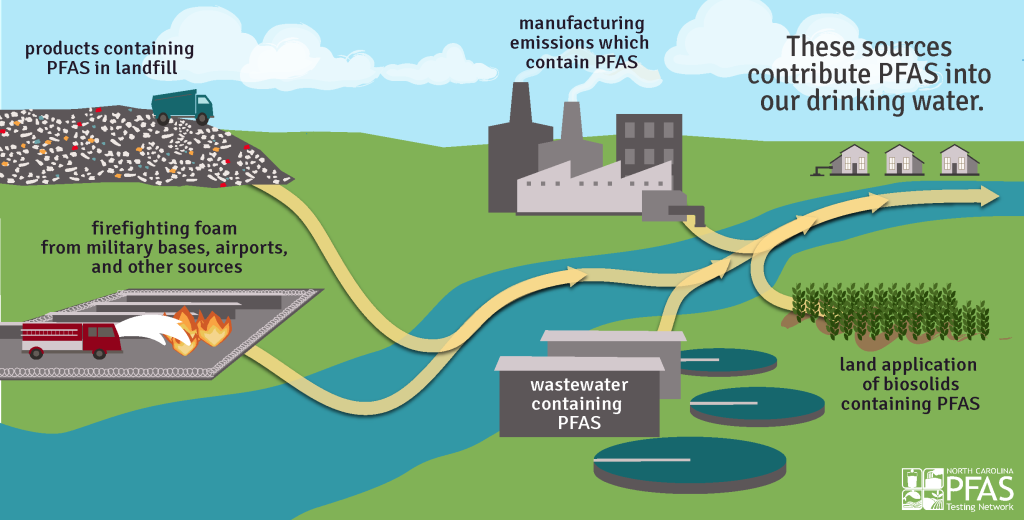
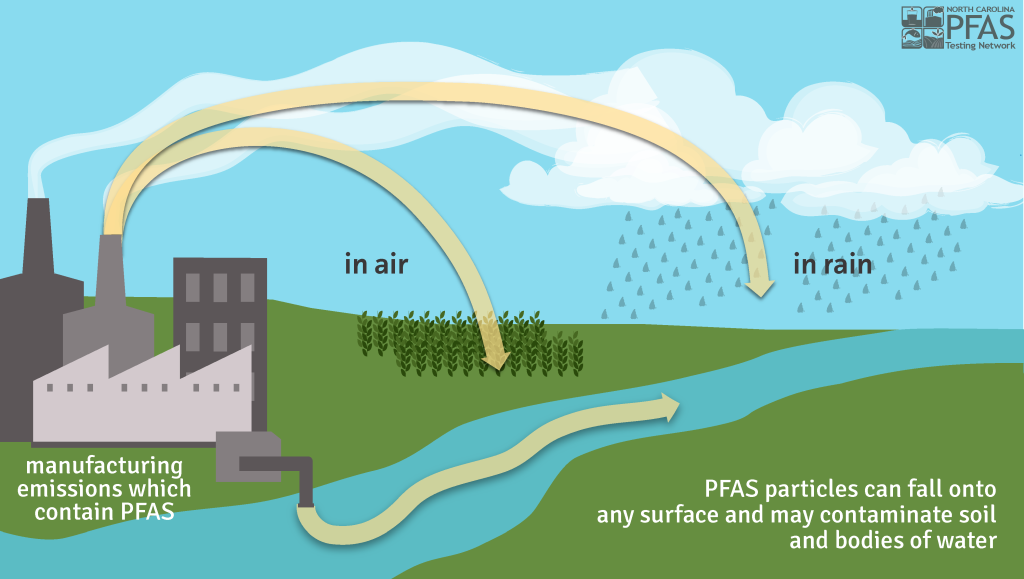
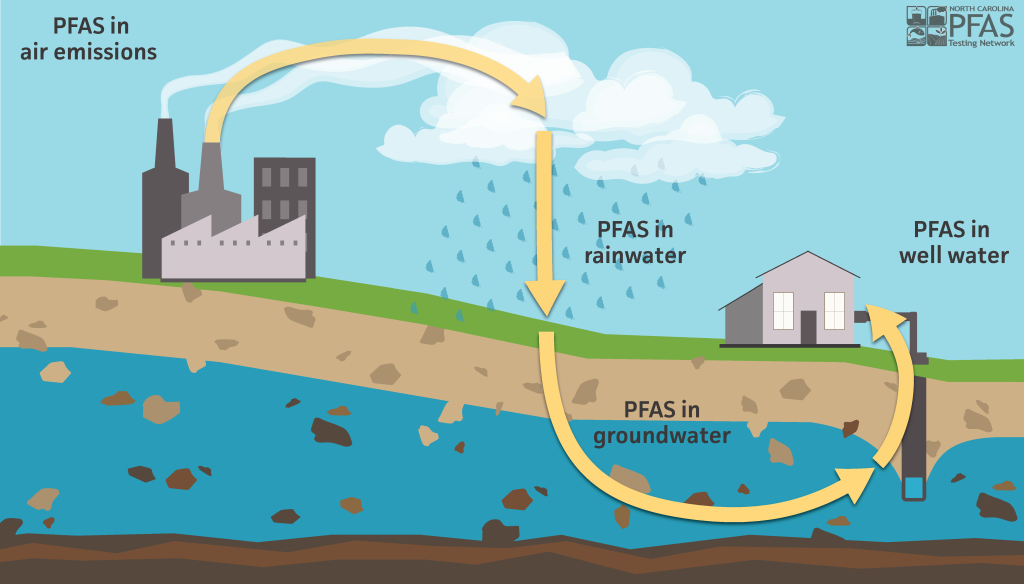
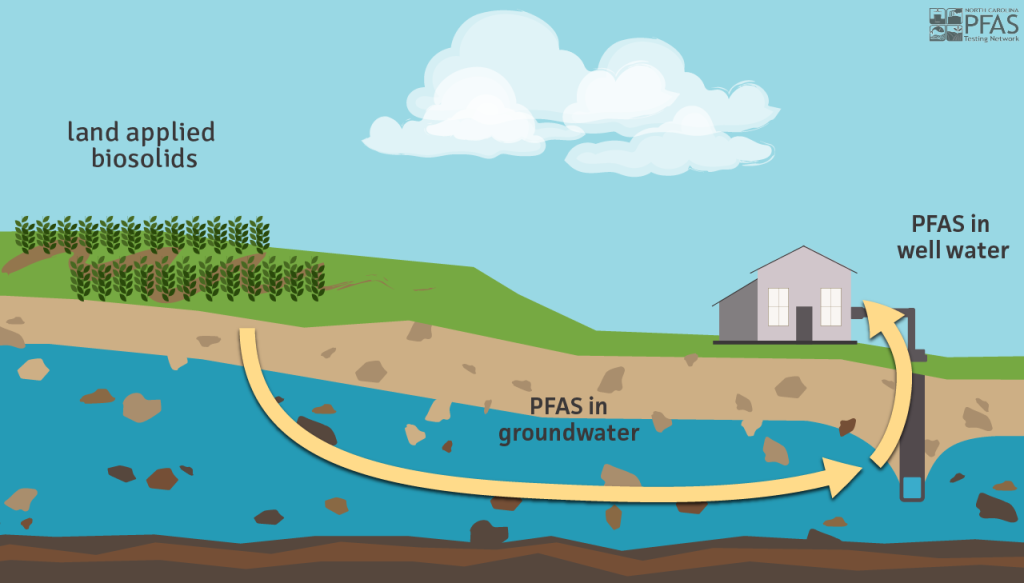
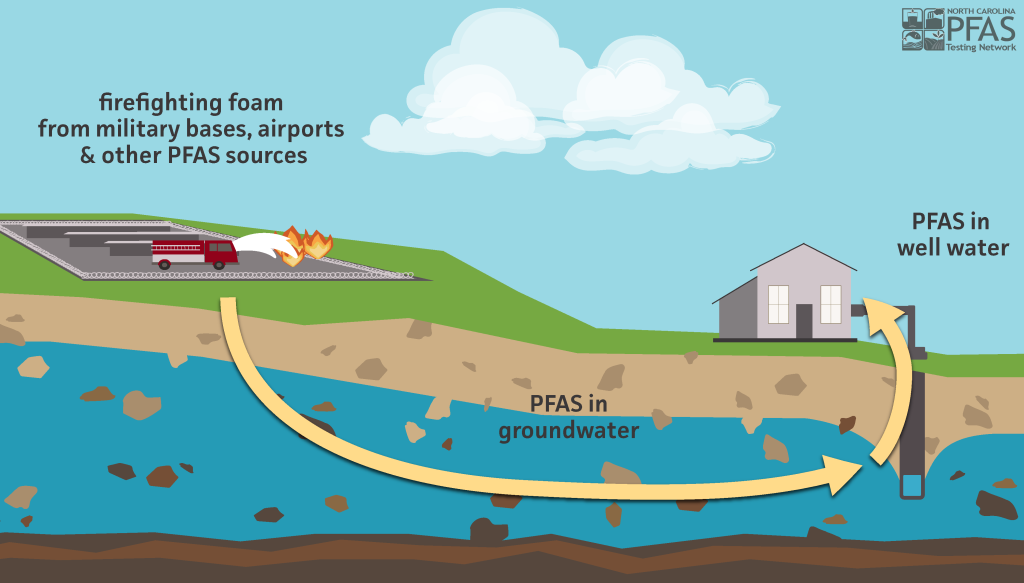
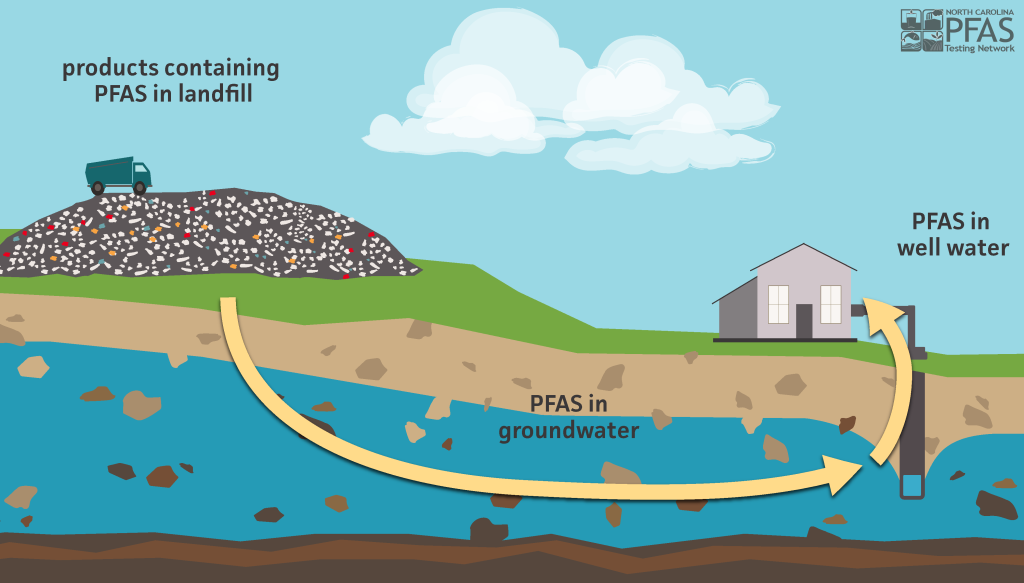
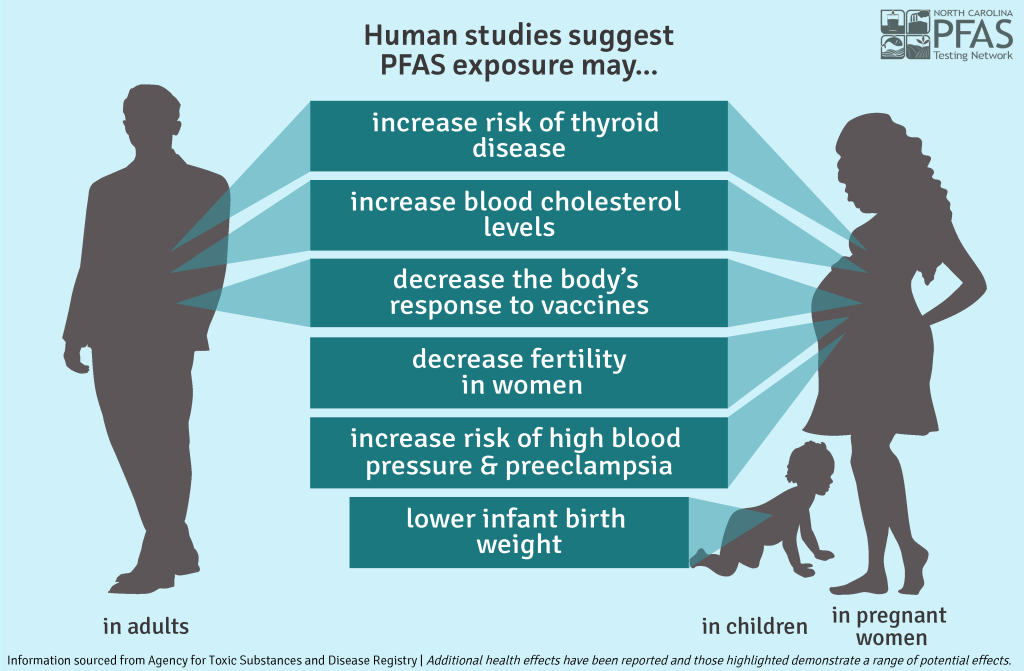
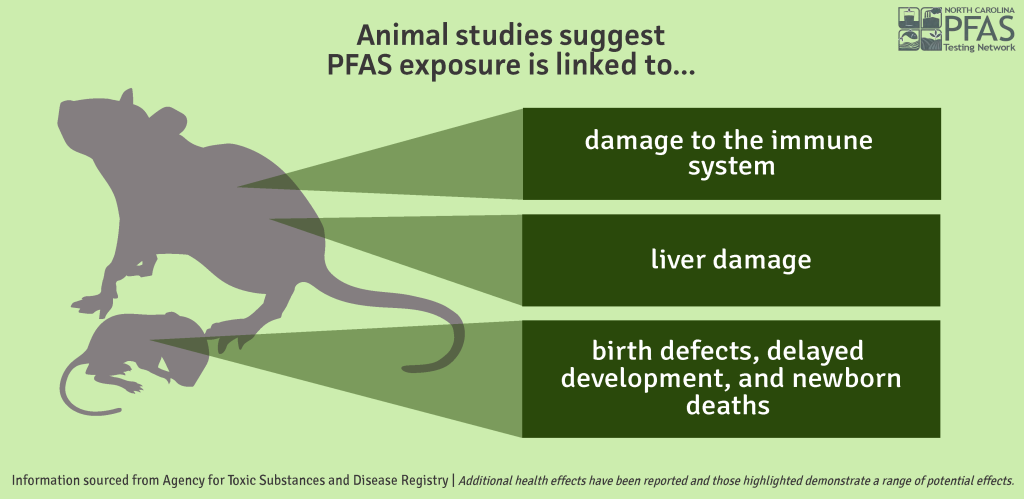
The graphics below were developed by the NC PFAST Network communications team and can be used in presentations to describe PFAS in the environment. To request minor edits to a graphic for presentation purposes, please contact Megan Lane at megan.lane@unc.edu.

